To read a dump file in Windows 10, install WinDbg, a free debugger from Microsoft. Open the newest file in C:\Windows\Minidump, then type !analyze -v and press Enter. The report shows the error name and, often, the driver that caused the crash.
Applies to: Windows 10. Windows 10 reached end of support on October 14, 2025, and only PCs enrolled in Extended Security Updates still get security fixes, through October 12, 2027.
Find the dump files
When Windows crashes with a blue screen, it saves a small dump file in C:\Windows\Minidump. Each file is named with the date of the crash. On Windows 11, you can also check crash logs in Reliability Monitor and Event Viewer.
- Press Windows key + E and go to C:\Windows\Minidump. Select Continue if Windows asks for permission.
- Copy the newest .dmp file to your desktop so it’s easy to open.
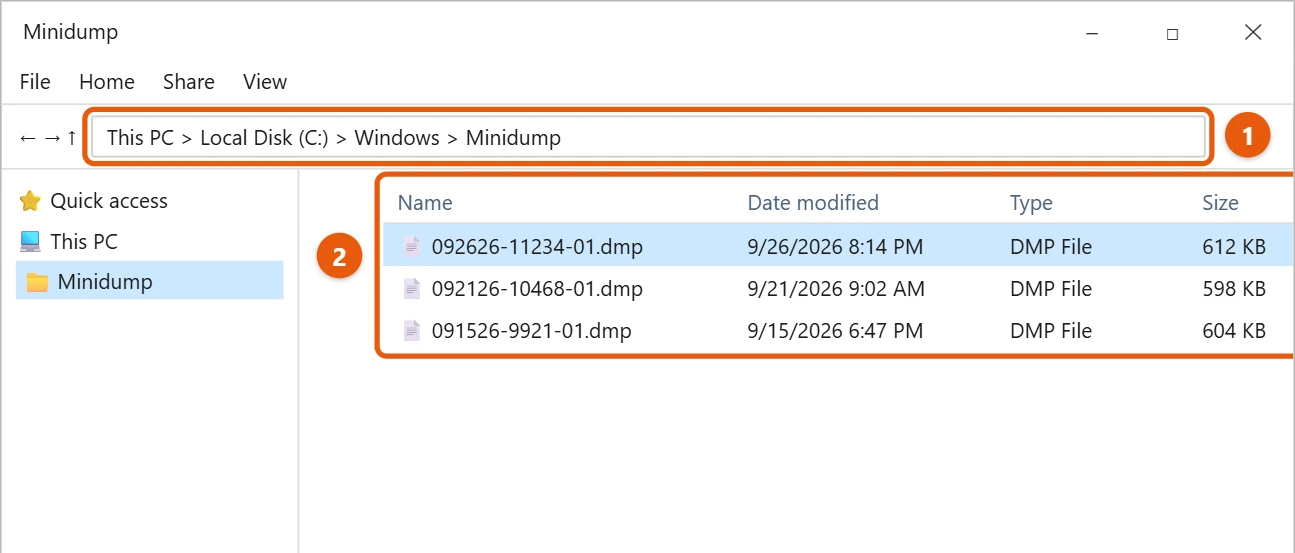
If the folder is missing or empty, Windows may not be saving dump files. Go to Control Panel > System > Advanced system settings > Startup and Recovery > Settings, and set Write debugging information to Small memory dump.
Other dump files you might see
- C:\Windows\MEMORY.DMP: a larger dump that holds more of the system memory from the last crash. It opens in WinDbg the same way but takes longer to load.
- C:\Windows\LiveKernelReports: reports Windows makes when something like the graphics driver hangs and recovers without a blue screen.
Open the dump file in WinDbg
- Open the Microsoft Store, search for WinDbg, and install it.
- Open WinDbg, select File > Start debugging > Open dump file, and choose the .dmp file.
- Wait for it to load. It may take a minute to download the files it needs.
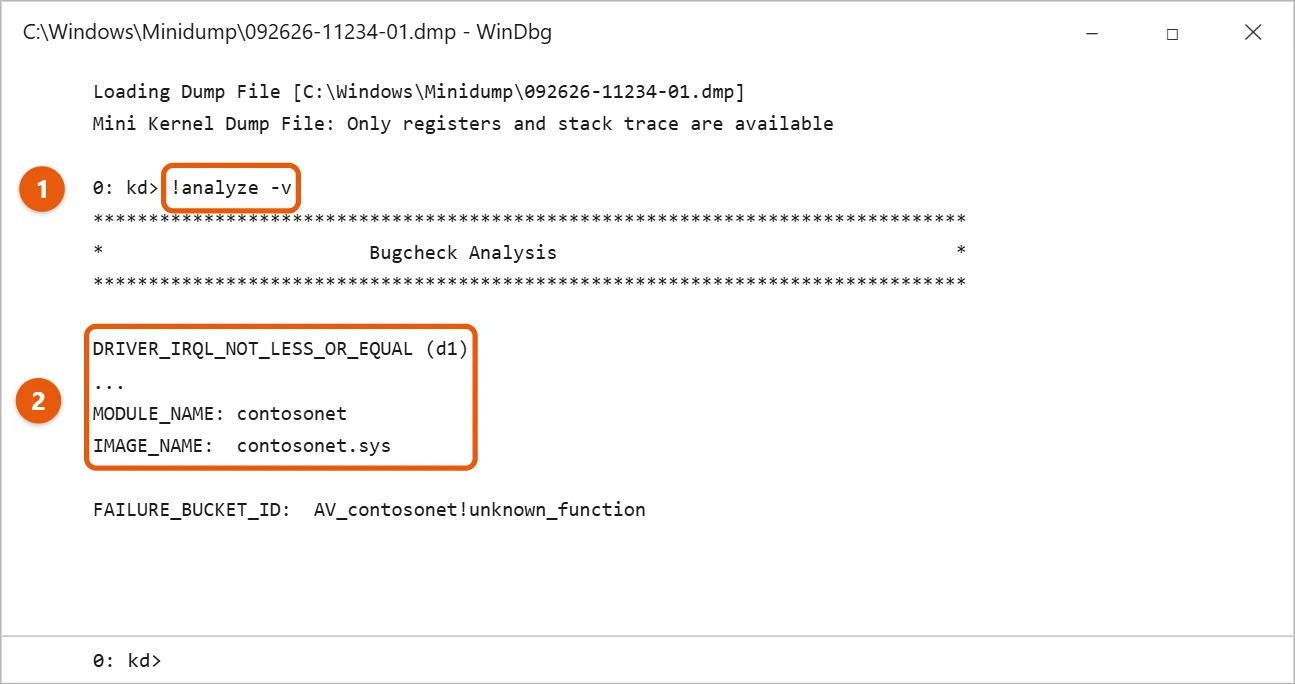
- Type
!analyze -vat the bottom and press Enter.
Read the results
- The first line in capital letters is the stop code, like DRIVER_IRQL_NOT_LESS_OR_EQUAL. Search for it on Microsoft’s site to learn what it means.
- MODULE_NAME and IMAGE_NAME often name the driver that crashed, like contosonet.sys. If it belongs to a device, update or roll back that driver.
- If the report points to a Windows file, like ntoskrnl.exe, the real cause is often a driver or memory problem.
A quicker option: BlueScreenView
If WinDbg feels like too much, the free BlueScreenView from NirSoft reads the same minidump files with no setup. Download it from NirSoft’s site, unzip it, and run BlueScreenView.exe. It lists every crash in C:\Windows\Minidump with the date, the bug check code, such as IRQL_NOT_LESS_OR_EQUAL, and the driver file it blames.
Select a crash to see the drivers that were loaded at the time. The ones highlighted in pink are the likely cause. Search the driver file name to find which device it belongs to, then update or roll back that driver. BlueScreenView only reads small minidumps, so use WinDbg for a full MEMORY.DMP file.
If you can’t read a dump file
- The Minidump folder is empty. Windows usually needs a page file on drive C: to save dumps, so don’t turn the page file off. Cleanup tools, including Disk Cleanup’s System error minidump files option, can also delete them.
- WinDbg can’t load symbols. It needs an internet connection to download them. Type .symfix and press Enter, then .reload, and run !analyze -v again.
- Windows won’t let you open it because of permissions. Copy the file to your desktop first, as shown above, and open that copy.
- The report is hard to follow. Focus on the stop code and the MODULE_NAME line. Those two usually point to the cause.
Frequently asked questions
Is there an easier way to see crash history?
Yes. Press Windows key + R, type perfmon /rel, and press Enter to open Reliability Monitor. It lists crashes by date. You can also check the event logs in Windows 10.
What should I do after I find the cause?
Start with fixing the blue screen error in Windows 10. When a driver is to blame, update all your drivers, and when the report hints at memory, test your RAM.
Is it safe to delete dump files?
Yes. They’re only used for troubleshooting. Delete them once you’ve fixed the problem, or let Disk Cleanup remove them.
Should I send my dump file to someone?
Only to people you trust, such as Microsoft or your PC maker’s support team. A dump can contain bits of whatever was in memory at the time, including personal information.
My PC keeps crashing with different stop codes. What does that mean?
When the stop code changes every time, the cause is often hardware, such as faulty memory or an overheating part, rather than one driver. Run Windows Memory Diagnostic by typing mdsched in the Start search box, and check that the fans and vents are clean.
Does this work on Windows 11?
Yes. Windows 11 saves dumps in the same folders, and WinDbg works the same way.
Microsoft’s reference is Read small memory dump files.

Matt Jacobs writes and maintains the guides on Support Your Tech, which he started in 2017. He spent most of his career keeping small-business PCs running and still takes the occasional consulting job, so the steps here come from fixing the same problems on other people’s computers. Every guide is checked on his own Windows 11, Windows 10, Mac, iPhone and iPad before it goes up.